
Screen Time + Digital Wellbeing Score
I wanted to know whether my digital life was actually healthy, not just how many hours I'd racked up — so I built a digital wellbeing score into RafeOS.

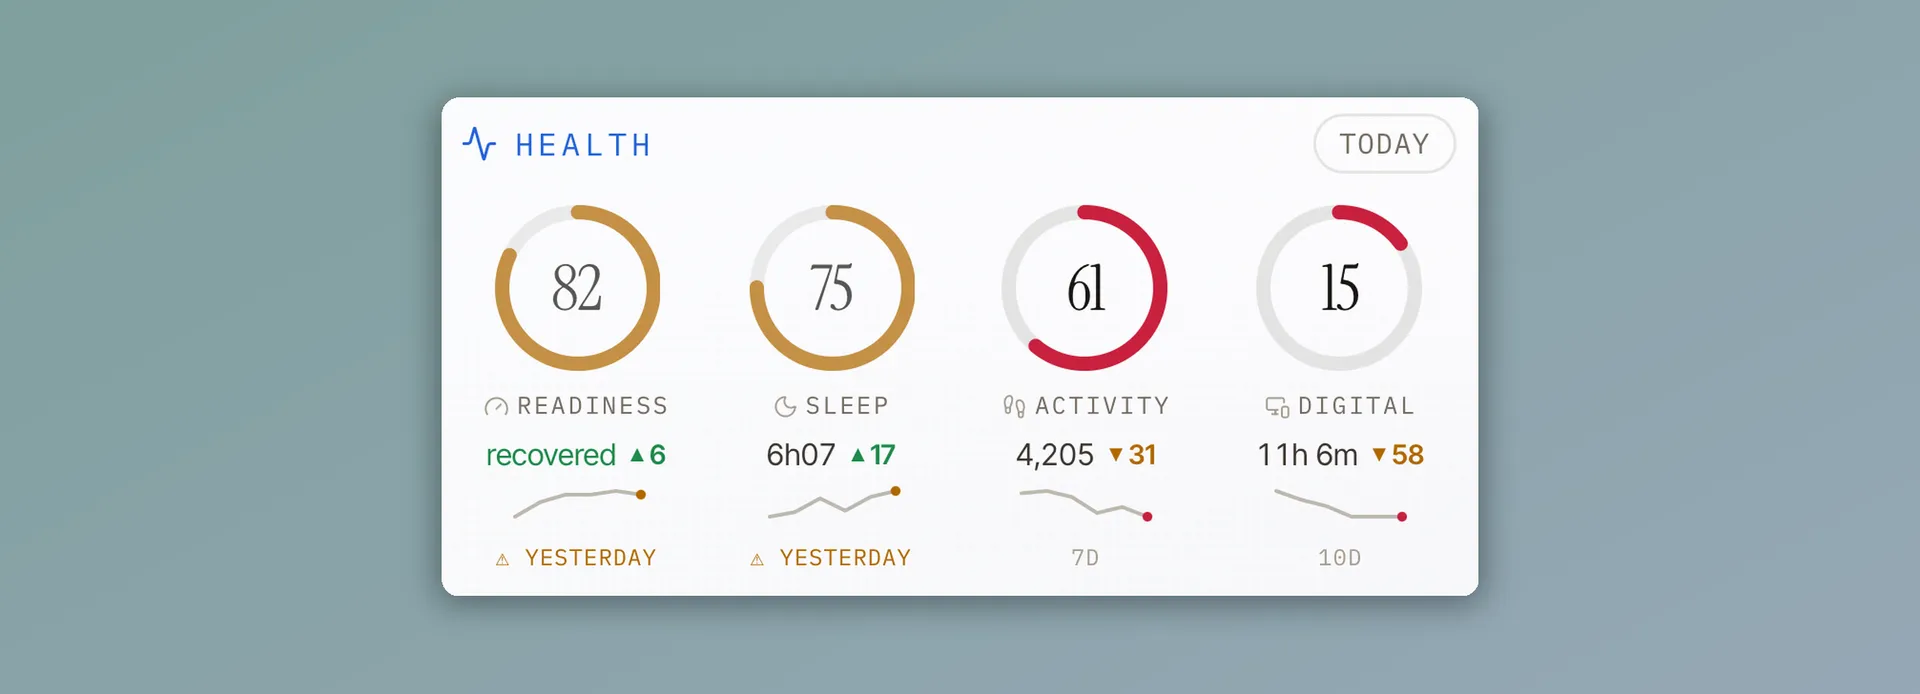
I've been building RafeOS, a personal data and tooling layer that pulls my health, calendar, mail, home and reading into one place I can query. The latest piece scratches an itch I've had for years: I spend a lot of time on screens, most of it deliberately (and it feels like it is increasing), and I wanted to know whether my digital life was actually healthy — not just how many hours the phone's Screen Time tab guilt-trips me with.
So I built a digital-wellbeing score: a single 0–100 number per day, higher = healthier, sitting next to my Oura readiness, sleep and activity scores. This is the story of how it works, and what happened when I made the model argue with the actual research literature.
The shape of the problem
Three things make "scoring screen time" harder than it looks.
First, getting honest data. Most screen-time research is built on self-report, which is badly inaccurate — people's estimates explain less than half the variance in their actual measured use. I wanted passive, measured data. On the Mac that's easily done with ActivityWatch (which app is in focus, am I actually at the keyboard); on the iPhone it's the existing Apple Screen Time (imported into ActivityWatch using an Importer.
Second, my Mac isn't always on. So the architecture pushes rather than pulls: a little job on the Mac wakes up hourly, builds a compact daily rollup from the local data, and POSTs it to the always-on server, which means there's an always available data store (and it also allows to do some post-processing). Re-sending a rolling few days is free (the ingest is idempotent), so if the Mac sleeps through a slot, the gap heals itself on the next wake.
Third, the interesting one: what should the score actually reward? That's where I stopped agentic coding and went back to the evidence.
What the research actually says (and what it doesn't)
I had an agent do a proper, sourced literature review — meta-analyses and primary studies, not wellness blogs. The findings genuinely reshaped the model. A few that mattered:
- Total screen-time hours barely predict wellbeing. The best methodological work here found digital-technology use explains at most 0.4% of the variance in wellbeing — about the same as whether you wear glasses. The dose-response is a gentle inverted-U ("Goldilocks"), not "more is worse". So a model that makes raw hours the main axis of health is building on the weakest part of the literature.
- Timing is the strongest, most actionable lever. Late-night use robustly associates with worse sleep (media-use ↔ sleep problems pools around r ≈ 0.28), and the mechanism is displacement and arousal: you stay up, the content keeps you alert. Blue light is the weakest leg, its interventions mostly failing to reach significance. So: penalise the late doomscroll, and don't bother with blue-light theatre.
- Long focused sessions are healthy; fragmentation is the harm. This one flipped a contributor on its head. I'd originally penalised long unbroken sessions (a "take a break" instinct). But for a knowledge worker the attention literature says the opposite — task-switching and constant interruption are what fragments attention and raise stress; a two-hour deep-work block is the good pattern. My "breaks" penalty was punishing exactly the behaviour I want more of. It became a fragmentation penalty instead.
- It's compulsive checking, not hours, that flags trouble. The construct with real predictive power is "problematic smartphone use" — the unlock-every-ten-minutes pattern — not total foreground time. My model had no measure of this. It became the single most evidence-aligned thing I added: pickups.
- Exercise offsets the sedentary cost. The best causal-leaning evidence in the whole area is that moderate physical activity substantially cancels the health risk of sitting. So a day with a logged workout should forgive a lot of screen volume — which reframed "volume" from a wellbeing axis (weak) to a sedentary one (well-evidenced), gated on whether I'd moved.
And one nice adversarial catch: the viral "checking your phone within 5 minutes of waking spikes cortisol 31%" stat? It doesn't trace to any real study. The agent flagged it as unverifiable. So morning-use gets, at most, a soft nudge — not a confident penalty.
The model that fell out of that
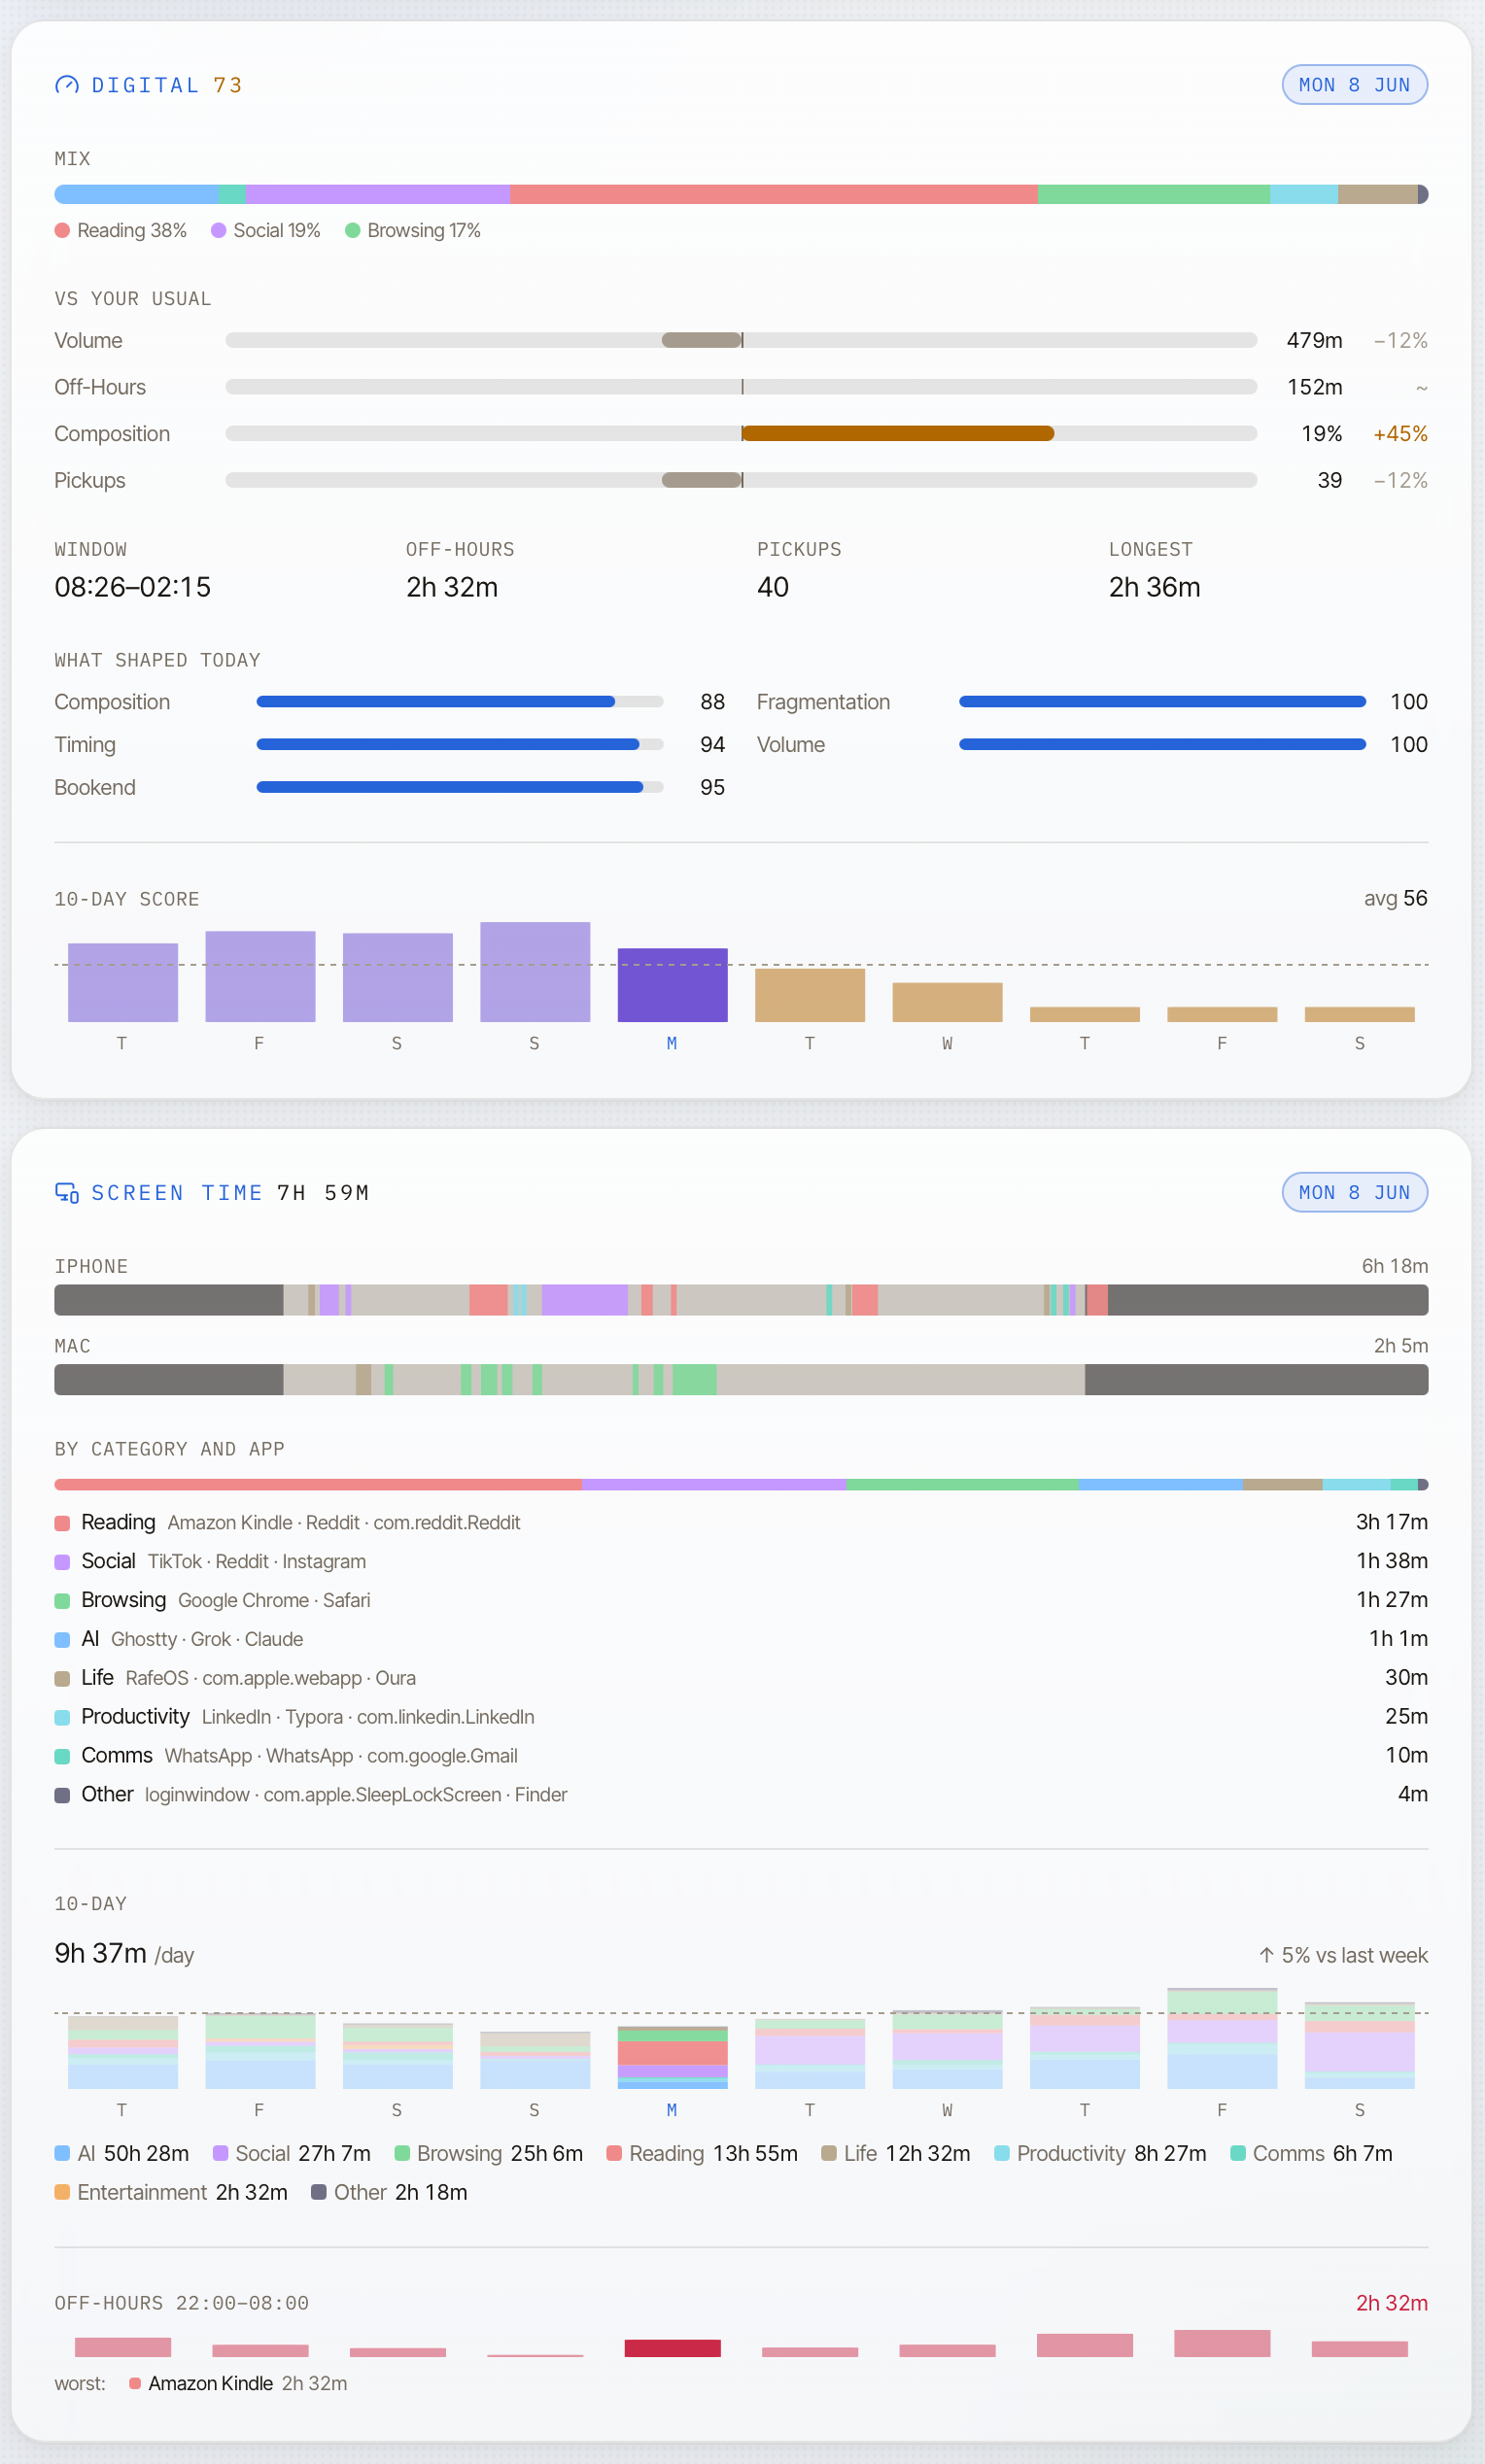
The score starts every day at 100 and subtracts points across nine contributors, in two layers.
Five "backbone" contributors grade the day on its own terms:
- Composition — the share of the day in social + entertainment (the "reduce" tier). Proportional, so an extra hour of coding doesn't dilute it.
- Fragmentation — category-switching per hour; deep focus scores well.
- Timing — off-hours use, with after-midnight weighted 3× and late work charged a quarter of late doomscrolling.
- Volume — a sedentary signal, biting past ~8h but largely forgiven by a logged workout.
- Bookend — how late the last screen of the night was, doubled if it was mindless content (the revenge-bedtime tail).
Four "balance" contributors then compare today to my own trailing two-week norm — volume, off-hours, composition and pickups, each vs usual. This is the part borrowed straight from Oura: its Readiness and Activity scores weight your recent baseline, precisely so the number means "good for you" rather than against some population average that was never going to fit a desk worker who's online 10 hours a day by design. Being above your usual costs points; being below earns a few back.
There's a deliberate guard against the obvious failure mode of personal baselines — drift. If I slowly creep to twelve-hour days, a purely relative score would just normalise it. So the backbone stays absolute (the 8h-ish line still bites regardless of my norm), and balance is only a lighter modifier on top. Belt and braces.
The decision I kept coming back to: today is "pending"
An interesting feature note was deciding not to score today.
It's tempting to show a live number, the way activity trackers shows progress through the day. But Oura's sleep score works because it grades something already finished — last night's sleep. Digital is the opposite: a lot of its quality signals (the late-night use, the bookend, the evening pickups, the total volume) are back-loaded in the evening. A score computed at 2pm would be systematically flattering: the bad stuff simply hasn't happened yet. And quietly showing yesterday's number labelled "today" isn't helpful.
So you'll see the day's card shows an honest "still collecting" state — your real running totals and a live composition strip, but no score — and only finalises the number once the day is complete (I run the days 4am-to-4am, like Oura, so "a day" is the span between two sleeps rather than a calendar artefact). The score freezes, and from then on everything just reads it.
Couldn't have: real iPhone pickups
A tangent worth mentioning. Mac pickups were easy — macOS quietly logs every screen wake, and you can count them. iPhone pickups, the number Apple shows you right there in Settings, turned out to be a wall. The data is genuinely on my Mac (Screen Time syncs across devices, pickup counts and all) — but Apple seals it in a sandboxed "data vault" that even Full Disk Access can't open; only Apple's own process may read it. The iPhone's own copy is excluded from backups. Every route that works needs a forensic extraction, not a daily job.
So I did the honest thing: real pickups on the Mac, a clearly-labelled proxy (session count) on the phone, and a note in the code so nobody re-litigates it. A good reminder that "the data exists" and "you can have the data" are different sentences.
What I learned
The build was maybe a third of the work; the rest was product work, deciding what to measure, and letting the research-based evidence overrule my instincts. My original model would have docked me for deep work, leaned on screen-time hours the literature says barely matter, and missed the compulsive-checking signal that actually predicts harm. The research didn't just tune the weights, it changed which contributors existed.
There's a broader RafeOS principle in there: a personal metric is only worth having if it's honest. Honest about uncertainty (today is pending, not faked), about provenance (real vs proxy), and about what the science does and doesn't support. A number that flatters you isn't wellbeing — it's a dashboard.
Next: a personalised "by this time of day" comparison so the live view can tell me I'm already heavier than usual — and a longer look at whether the categories still make sense once I've got a couple of months of clean data.
New writing by email
Occasional pieces on product, technology and AI — and how they actually play out in practice.


